Tracing
Promptfoo supports OpenTelemetry (OTLP) tracing to help you understand the internal operations of your LLM providers during evaluations.
This feature allows you to collect detailed performance metrics and debug complex provider implementations.
Overview
Promptfoo acts as an OpenTelemetry receiver, collecting traces from your providers and displaying them in the web UI. This eliminates the need for external observability infrastructure during development and testing.
Tracing provides visibility into:
- Provider execution flow: See how your providers process requests internally
- Performance bottlenecks: Identify slow operations in RAG pipelines or multi-step workflows
- Error tracking: Trace failures to specific operations
- Resource usage: Monitor external API calls, database queries, and other operations
Key Features
- Standard OpenTelemetry support: Use any OpenTelemetry SDK in any language
- Built-in OTLP receiver: No external collector required for basic usage
- Web UI visualization: View traces directly in the Promptfoo interface
- Automatic correlation: Traces are linked to specific test cases and evaluations
- Flexible forwarding: Send traces to Jaeger, Tempo, or any OTLP-compatible backend
Built-in Provider Instrumentation
Promptfoo automatically instruments its built-in providers with OpenTelemetry spans following GenAI Semantic Conventions. When tracing is enabled, every provider call creates spans with standardized attributes.
Supported Providers
The following providers have built-in instrumentation:
| Provider | Automatic Tracing |
|---|---|
| OpenAI | ✓ |
| Anthropic | ✓ |
| Azure OpenAI | ✓ |
| AWS Bedrock | ✓ |
| Google Vertex AI | ✓ |
| Ollama | ✓ |
| Mistral | ✓ |
| Cohere | ✓ |
| Huggingface | ✓ |
| IBM Watsonx | ✓ |
| HTTP | ✓ |
| OpenRouter | ✓ |
| Replicate | ✓ |
| OpenAI-compatible (Deepseek, Perplexity, etc.) | ✓ (inherited) |
| Cloudflare AI | ✓ (inherited) |
GenAI Span Attributes
Each provider call creates a span with these attributes:
Request Attributes:
gen_ai.system- Provider system (e.g., "openai", "anthropic", "azure", "bedrock")gen_ai.operation.name- Operation type ("chat", "completion", "embedding")gen_ai.request.model- Model namegen_ai.request.max_tokens- Max tokens settinggen_ai.request.temperature- Temperature settinggen_ai.request.top_p- Top-p settinggen_ai.request.stop_sequences- Stop sequences
Response Attributes:
gen_ai.usage.input_tokens- Input/prompt token countgen_ai.usage.output_tokens- Output/completion token countgen_ai.usage.total_tokens- Total token countgen_ai.usage.cached_tokens- Cached token count (if applicable)gen_ai.usage.reasoning_tokens- Reasoning token count (for o1, DeepSeek-R1)gen_ai.response.finish_reasons- Finish/stop reasons
Promptfoo-specific Attributes:
promptfoo.provider.id- Provider identifierpromptfoo.test.index- Test case indexpromptfoo.prompt.label- Prompt labelpromptfoo.cache_hit- Whether the response was served from cachepromptfoo.request.body- The request body sent to the provider (truncated to 4KB)promptfoo.response.body- The response body from the provider (truncated to 4KB)
Example Trace Output
When calling OpenAI's GPT-4:
Span: chat gpt-4
├─ gen_ai.system: openai
├─ gen_ai.operation.name: chat
├─ gen_ai.request.model: gpt-4
├─ gen_ai.request.max_tokens: 1000
├─ gen_ai.request.temperature: 0.7
├─ gen_ai.usage.input_tokens: 150
├─ gen_ai.usage.output_tokens: 85
├─ gen_ai.usage.total_tokens: 235
├─ gen_ai.response.finish_reasons: ["stop"]
├─ promptfoo.provider.id: openai:chat:gpt-4
└─ promptfoo.test.index: 0
Quick Start
1. Enable Tracing
Add tracing configuration to your promptfooconfig.yaml:
tracing:
  enabled: true # Required to send OTLP telemetry
  otlp:
    http:
      enabled: true # Required to start the built-in OTLP receiver
2. Instrument Your Provider
Promptfoo passes a W3C trace context to providers via the traceparent field. Use this to create child spans:
const { trace, context, SpanStatusCode } = require('@opentelemetry/api');
const { NodeTracerProvider } = require('@opentelemetry/sdk-trace-node');
const { OTLPTraceExporter } = require('@opentelemetry/exporter-trace-otlp-http');
const { SimpleSpanProcessor } = require('@opentelemetry/sdk-trace-base');
const { resourceFromAttributes } = require('@opentelemetry/resources');

// Initialize tracer (SDK 2.x API - pass spanProcessors to constructor)
const provider = new NodeTracerProvider({
  resource: resourceFromAttributes({ 'service.name': 'my-provider' }),
  spanProcessors: [
    new SimpleSpanProcessor(
      new OTLPTraceExporter({
        url: 'http://localhost:4318/v1/traces',
      }),
    ),
  ],
});
provider.register();

const tracer = trace.getTracer('my-provider');

module.exports = {
  async callApi(prompt, promptfooContext) {
    // Parse trace context from Promptfoo
    if (promptfooContext.traceparent) {
      const activeContext = trace.propagation.extract(context.active(), {
        traceparent: promptfooContext.traceparent,
      });

      return context.with(activeContext, async () => {
        const span = tracer.startSpan('provider.call');

        try {
          // Your provider logic here
          span.setAttribute('prompt.length', prompt.length);

          const result = await yourLLMCall(prompt);

          span.setStatus({ code: SpanStatusCode.OK });
          return { output: result };
        } catch (error) {
          span.recordException(error);
          span.setStatus({
            code: SpanStatusCode.ERROR,
            message: error.message,
          });
          throw error;
        } finally {
          span.end();
        }
      });
    }

    // Fallback for when tracing is disabled
    return { output: await yourLLMCall(prompt) };
  },
};
3. View Traces
After running an evaluation, view traces in the web UI:
-
Run your evaluation:
promptfoo eval -
Open the web UI:
promptfoo view -
Click the magnifying glass (🔎) icon on any test result
-
Scroll to the "Trace Timeline" section
4. Assert on Traced Workflows
Once traces are flowing into Promptfoo, you can evaluate what the agent actually did, not just the final answer:
tests:
  - vars:
      order_id: '123'
    assert:
      - type: trajectory:tool-used
        value: search_orders

      - type: trajectory:tool-args-match
        value:
          name: search_orders
          args:
            order_id: '{{ order_id }}'

      - type: trajectory:tool-sequence
        value:
          steps:
            - search_orders
            - compose_reply

      - type: trajectory:goal-success
        value: 'Determine the shipping status for order {{ order_id }} and tell the user whether it has shipped'
        provider: openai:gpt-5-mini
Use trajectory assertions when your spans identify tools, commands, searches, reasoning steps, or messages. If you only need raw span counts, durations, or error detection, use trace-span-count, trace-span-duration, or trace-error-spans.
Configuration Reference
Basic Configuration
tracing:
  enabled: true # Enable/disable tracing
  otlp:
    http:
      enabled: true # Required to start the OTLP receiver
      # port: 4318   # Optional - defaults to 4318 (standard OTLP HTTP port)
      # host: '0.0.0.0'  # Optional - defaults to '0.0.0.0'
      # acceptFormats: ['json', 'protobuf']  # Optional - defaults to both
Supported Formats
Promptfoo's OTLP receiver accepts traces in both JSON and protobuf formats:
| Format | Content-Type | Use Case |
|---|---|---|
| JSON | application/json | JavaScript/TypeScript (default) |
| Protobuf | application/x-protobuf | Python (default), Go, Java, and other languages |
Protobuf is more efficient for serialization and produces smaller payloads. Python's OpenTelemetry SDK uses protobuf by default.
Environment Variables
You can also configure tracing via environment variables:
# Enable tracing
export PROMPTFOO_TRACING_ENABLED=true

# Configure OTLP endpoint (for providers)
export OTEL_EXPORTER_OTLP_ENDPOINT="http://localhost:4318"

# Set service name
export OTEL_SERVICE_NAME="my-rag-application"

# Authentication headers (if needed)
export OTEL_EXPORTER_OTLP_HEADERS="api-key=your-key"
Forwarding to External Collectors
Forward traces to external observability platforms:
tracing:
  enabled: true
  otlp:
    http:
      enabled: true
  forwarding:
    enabled: true
    endpoint: 'http://jaeger:4318' # or Tempo, Honeycomb, etc.
    headers:
      'api-key': '{{ env.OBSERVABILITY_API_KEY }}'
Provider Implementation Guide
JavaScript/TypeScript
For complete provider implementation details, see the JavaScript Provider documentation. For tracing-specific examples, see the OpenTelemetry tracing example.
Key points:
- Use
SimpleSpanProcessorfor immediate trace export - Extract the W3C trace context from
traceparent - Create child spans for each operation
- Set appropriate span attributes and status
- Add tool-oriented attributes like
tool.nameorfunction.namewhen you want to use trajectory assertions
Python
For complete provider implementation details, see the Python Provider documentation. For a working example with protobuf tracing, see the Python OpenTelemetry tracing example.
Python's opentelemetry-exporter-otlp-proto-http package uses protobuf format by default (application/x-protobuf), which is more efficient than JSON.
from opentelemetry import trace
from opentelemetry.propagate import extract
from opentelemetry.sdk.trace import TracerProvider
from opentelemetry.sdk.trace.export import SimpleSpanProcessor
from opentelemetry.exporter.otlp.proto.http.trace_exporter import OTLPSpanExporter

# Setup - uses protobuf format by default
provider = TracerProvider()
exporter = OTLPSpanExporter(endpoint="http://localhost:4318/v1/traces")
provider.add_span_processor(SimpleSpanProcessor(exporter))
trace.set_tracer_provider(provider)
tracer = trace.get_tracer(__name__)

def call_api(prompt, context):
    # Extract trace context
    if 'traceparent' in context:
        ctx = extract({"traceparent": context["traceparent"]})
        with tracer.start_as_current_span("provider.call", context=ctx) as span:
            span.set_attribute("prompt.length", len(prompt))
            # Your provider logic here
            result = your_llm_call(prompt)
            return {"output": result}

    # Fallback without tracing
    return {"output": your_llm_call(prompt)}
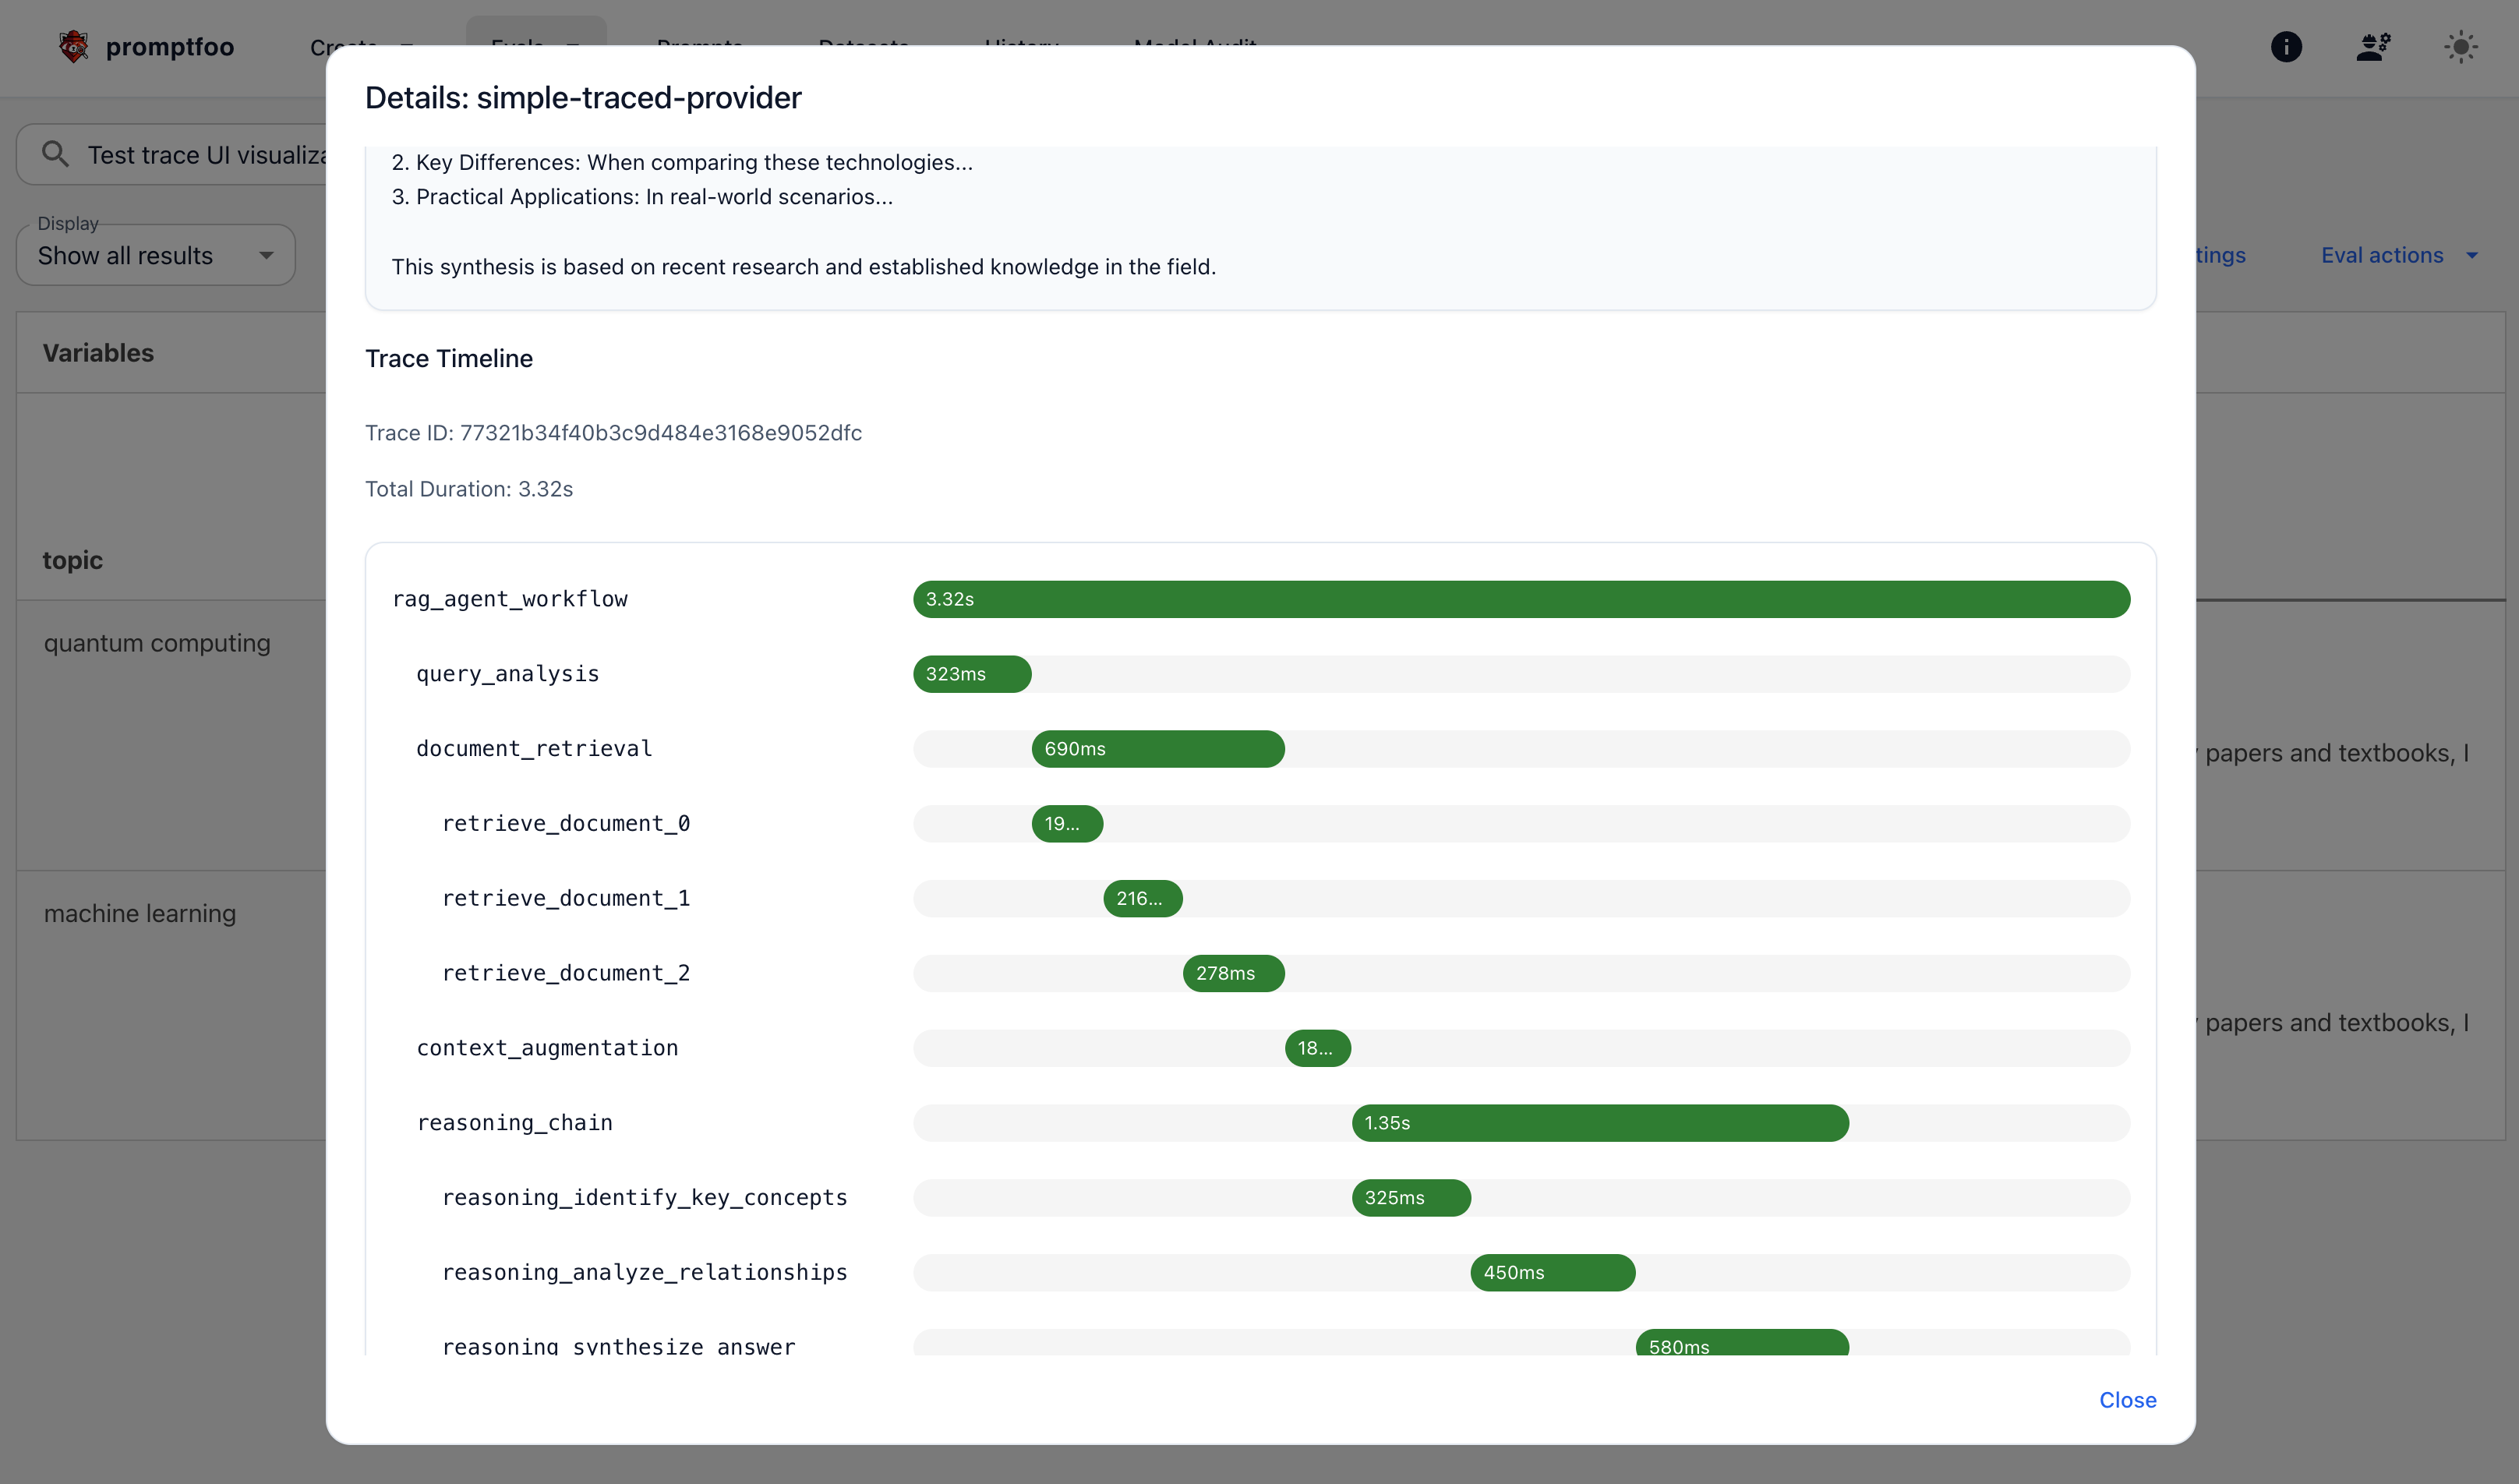
Trace Visualization
Promptfoo includes a built-in trace viewer that displays all collected telemetry data. Since Promptfoo functions as an OTLP receiver, you can view traces directly without configuring external tools like Jaeger or Grafana Tempo.
The web UI displays traces as a hierarchical timeline showing:
- Span hierarchy: Parent-child relationships between operations
- Duration bars: Visual representation of operation timing
- Status indicators: Success (green), error (red), or unset (gray)
- Hover details: Span attributes, duration, and timestamps
- Relative timing: See which operations run in parallel vs. sequentially
- Expandable details: Click any span to reveal full attribute information
- Export functionality: Download traces as JSON for external analysis
Understanding the Timeline
[Root Span: provider.call (500ms)]
  ├─[Retrieve Documents (100ms)]
  ├─[Prepare Context (50ms)]
  └─[LLM Generation (300ms)]
Each bar's width represents its duration relative to the total trace time. Hover over any span to see:
- Exact start and end timestamps
- Duration in milliseconds or seconds
- Custom attributes you've added
- Error messages (if any)
Span Details Panel
Click the expand icon on any span to reveal a detailed attributes panel showing:
- Span ID and Parent Span ID for tracing relationships
- Start and End timestamps with precision
- Duration in a human-readable format
- Status (OK, ERROR, or UNSET)
- All span attributes including GenAI attributes, custom attributes, and Promptfoo-specific data
This is useful for inspecting the full request/response bodies (promptfoo.request.body and promptfoo.response.body) and debugging provider behavior.
Exporting Traces
Click the Export Traces button to download all traces for the current evaluation or test case as a JSON file. The export includes:
- Evaluation ID and test case ID
- Export timestamp
- Complete trace data with all spans and attributes
The exported JSON can be imported into external tools like Jaeger, Grafana Tempo, or custom analysis scripts.
Best Practices
1. Semantic Naming
Use descriptive, hierarchical span names:
// Good
'rag.retrieve_documents';
'rag.rank_results';
'llm.generate_response';

// Less informative
'step1';
'process';
'call_api';
2. Add Relevant Attributes
Include context that helps debugging:
span.setAttributes({
  'prompt.tokens': tokenCount,
  'documents.count': documents.length,
  'model.name': 'gpt-4',
  'cache.hit': false,
});
3. Handle Errors Properly
Always record exceptions and set error status:
try {
  // Operation
} catch (error) {
  span.recordException(error);
  span.setStatus({
    code: SpanStatusCode.ERROR,
    message: error.message,
  });
  throw error;
}
4. Use Appropriate Span Processors
- SimpleSpanProcessor: For development and testing (immediate export)
- BatchSpanProcessor: For production (better performance)
Advanced Features
Custom Trace Attributes
Add metadata that appears in the UI:
span.setAttributes({
  'user.id': userId,
  'feature.flags': JSON.stringify(featureFlags),
  version: packageVersion,
});
Trace Sampling
Reduce overhead in high-volume scenarios:
const { TraceIdRatioBasedSampler } = require('@opentelemetry/sdk-trace-base');

const provider = new NodeTracerProvider({
  sampler: new TraceIdRatioBasedSampler(0.1), // Sample 10% of traces
});
Multi-Service Tracing
Trace across multiple services:
// Service A: Forward trace context
const headers = {};
trace.propagation.inject(context.active(), headers);
await fetch(serviceB, { headers });

// Service B: Extract and continue trace
const extractedContext = trace.propagation.extract(context.active(), request.headers);
Troubleshooting
Traces Not Appearing
- Check tracing is enabled: Verify
tracing.enabled: truein config - Verify OTLP endpoint: Ensure providers are sending to
http://localhost:4318/v1/traces - Check trace context: Log the
traceparentvalue to ensure it's being passed - Review provider logs: Look for connection errors or failed exports
Context Naming Conflicts
If you see context.active is not a function, rename the OpenTelemetry import:
// Avoid conflict with promptfoo context parameter
const { context: otelContext } = require('@opentelemetry/api');

async callApi(prompt, promptfooContext) {
  // Use otelContext for OpenTelemetry
  // Use promptfooContext for Promptfoo's context
}
Performance Impact
- Tracing adds ~1-2ms overhead per span
- Use sampling for high-volume evaluations
- Consider
BatchSpanProcessorfor production use
Debug Logging
Enable debug logs to troubleshoot:
# Promptfoo debug logs
DEBUG=promptfoo:* promptfoo eval

# OpenTelemetry debug logs
OTEL_LOG_LEVEL=debug promptfoo eval
Integration Examples
RAG Pipeline Tracing
async function ragPipeline(query, context) {
  const span = tracer.startSpan('rag.pipeline');

  try {
    // Retrieval phase
    const retrieveSpan = tracer.startSpan('rag.retrieve', { parent: span });
    const documents = await vectorSearch(query);
    retrieveSpan.setAttribute('documents.count', documents.length);
    retrieveSpan.end();

    // Reranking phase
    const rerankSpan = tracer.startSpan('rag.rerank', { parent: span });
    const ranked = await rerank(query, documents);
    rerankSpan.setAttribute('documents.reranked', ranked.length);
    rerankSpan.end();

    // Generation phase
    const generateSpan = tracer.startSpan('llm.generate', { parent: span });
    const response = await llm.generate(query, ranked);
    generateSpan.setAttribute('response.tokens', response.tokenCount);
    generateSpan.end();

    span.setStatus({ code: SpanStatusCode.OK });
    return response;
  } catch (error) {
    span.recordException(error);
    span.setStatus({ code: SpanStatusCode.ERROR });
    throw error;
  } finally {
    span.end();
  }
}
Multi-Model Comparison
async function compareModels(prompt, context) {
  const span = tracer.startSpan('compare.models');

  const models = ['gpt-4', 'claude-3', 'llama-3'];
  const promises = models.map(async (model) => {
    const modelSpan = tracer.startSpan(`model.${model}`, { parent: span });
    try {
      const result = await callModel(model, prompt);
      modelSpan.setAttribute('model.name', model);
      modelSpan.setAttribute('response.latency', result.latency);
      return result;
    } finally {
      modelSpan.end();
    }
  });

  const results = await Promise.all(promises);
  span.end();
  return results;
}
Red Team Tracing
When running red team tests, tracing provides a powerful capability: traces from your application's internal operations can be fed back to adversarial attack strategies, allowing them to craft more sophisticated attacks based on what they observe.
This creates a feedback loop where:
- Attack strategy sends a prompt to your application
- Your application processes the request, emitting trace spans (LLM calls, guardrails, tool executions, errors)
- Promptfoo captures these traces
- Traces are formatted and fed back to the attack strategy for the next iteration
- The attack strategy uses this information to craft a better attack
What Attackers Can See
When red team tracing is enabled, adversarial strategies receive visibility into:
- Guardrail decisions: Which content filters triggered and why
- Tool executions: Which tools were called with what timing
- Error conditions: Rate limits, parsing errors, validation failures
- LLM operations: Which models were used and when
- Performance patterns: Timing information that could reveal DoS vectors
Example trace summary provided to an attacker:
Trace 0af76519 • 5 spans

Execution Flow:
1. [1.2s] llm.generate (client) | model=gpt-4
2. [300ms] guardrail.check (internal) | tool=content-filter
3. [150ms] tool.database_query (server) | tool=search
4. [50ms] guardrail.check (internal) | ERROR: Rate limit exceeded

Key Observations:
• Guardrail content-filter decision: blocked
• Tool call search via "tool.database_query"
• Error span "guardrail.check": Rate limit exceeded
The attacker can now craft a follow-up attack that:
- Avoids triggering the
content-filterguardrail - Targets the rate limit error condition
- Exploits the specific tool execution pattern observed
Configuration
Enable red team tracing in your promptfooconfig.yaml:
tracing:
  enabled: true
  otlp:
    http:
      enabled: true

redteam:
  tracing:
    enabled: true
    # Feed traces to attack generation (default: true)
    includeInAttack: true
    # Feed traces to grading (default: true)
    includeInGrading: true
    # Filter which spans to include
    spanFilter:
      - 'llm.*'
      - 'guardrail.*'
      - 'tool.*'
  plugins:
    - harmful
  strategies:
    - jailbreak # Iterative strategy that benefits from trace feedback
Strategy-Specific Configuration
Different attack strategies can use different tracing settings:
redteam:
  tracing:
    enabled: true
    strategies:
      # Jailbreak benefits from seeing all internal operations
      jailbreak:
        includeInAttack: true
        maxSpans: 100
      # Crescendo focuses on guardrail decisions
      crescendo:
        includeInAttack: true
        spanFilter:
          - 'guardrail.*'
Example
See the red team tracing example for a complete working implementation.
For more details on red team testing with tracing, see How to Red Team LLM Agents.
Next Steps
- Explore the OpenTelemetry tracing example (JavaScript)
- Explore the OpenTelemetry tracing example (Python) - uses protobuf format
- Try the red team tracing example
- Set up forwarding to your observability platform
- Add custom instrumentation for your use case
- Use traces to optimize provider performance